Helper Helper's reporting engine gives administrators instant visibility into their entire service program. No more collecting paper slips, merging spreadsheets, or manually tallying hours at the end of the semester. Every data point updates in real time as students sign up, check in, and get validated.
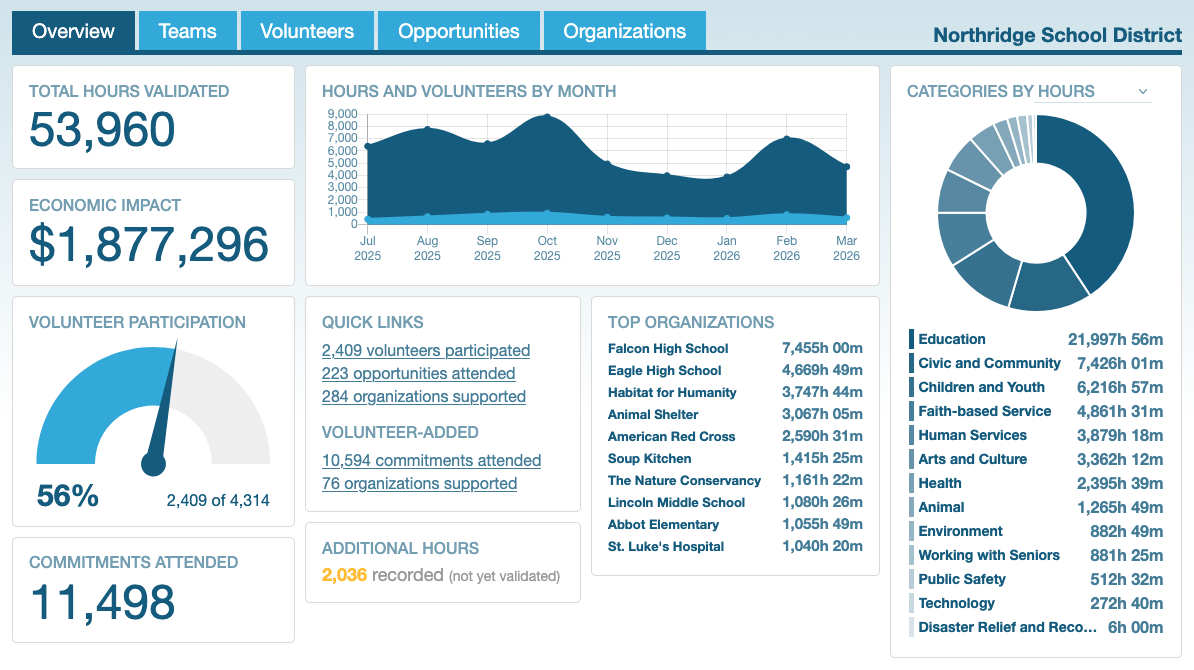

“One feature that we find informative is the Detailed Institution Report. This is our “one-stop shop” to see the big picture. We are able to see participation levels, economic impact of the service hours being completed, top service sites, summaries by the various categories of service, and monthly summaries. We find this quick look very helpful.”
Export in One Click
Every report is available as a detailed Excel spreadsheet with a single click. Choose your report, apply any filters, and download. Reports open in your favorite spreadsheet app, ready for pivot tables, custom charts, or importing into your school's reporting system.


Need to share raw data with your district office, accreditation reviewers, or board members? Just download and send; the data is clean, formatted, and ready to use.
Embed a Live Dashboard on Your Website
Showcase your program's impact right on your school's website. A small bit of copy-and-paste code adds a customizable dashboard report to any page, and it updates live as students log and validate hours.
Track Your Program's Economic Impact
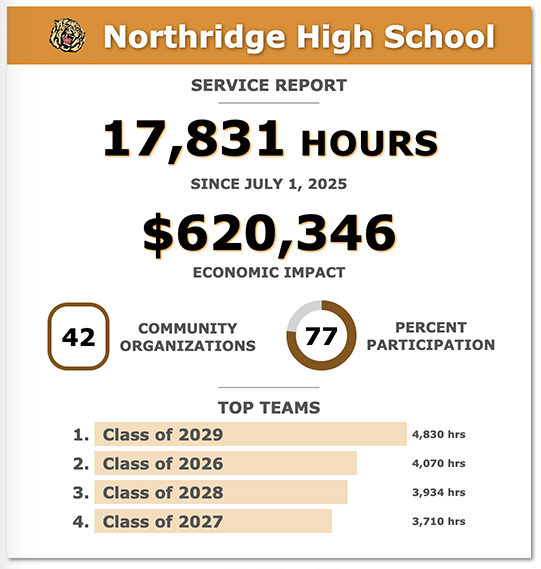
Every volunteer hour has a dollar value. Helper Helper automatically calculates the economic impact of your service hours, so you always have a concrete dollar figure ready for grant applications, school board presentations, and district reports.
Filter & Drill Down
Your institution report isn't just a static summary — it's a fully interactive reporting tool. Apply filters to slice your data by any combination of criteria and instantly see how the numbers change:
- By student — individual hour logs, goal progress, and complete activity history
- By class or grade — compare engagement across cohorts to spot trends and gaps
- By team or group — track NHS chapters, athletic teams, clubs, advisory groups, or any custom team
- By category — see which service areas draw the most participation and where to focus outreach
- By organization — understand which community partners are most utilized and which need attention
- By date range — semester, school year, quarter, or any custom period you define
Combine multiple filters to answer specific questions like "How many hours did our sophomore NHS members log at food banks this semester?"